Monday, March 31, 2014

The Floriston Rate

The Floriston Rate:
 
Location of the U.S. Geological Survey Gaging Station at
Farad, CA. Off Interstate route 80
The rates of flow known as "Floriston Rates" in the Truckee River Operating Agreement represent minimum flow rates that have to be met with water flowing from Lake Tahoe, any creeks tributary to the Truckee River and the several upstream reservoirs that impound water.  A gaging station operated by the U.S. Geological Survey near Farad, CA (23 miles west of Reno, NV on interstate route 80) measures flow and provides upstream water managers with benchmark flow rates that change with the seasons.  Florison rates vary between 300 cubic feet of water per second to 500 cubic feet of water per second, dependent in part upon the season.  The rates, based on the federally established operating agreement, specify that average flow in the Truckee be 500 cubic feet per second between 1 March and 30 September.  For the rest of the year (1 October to 28 February) average flows must be at least 400 cubic feet per second.  These flows need to be maintained to meet the needs of downstream water users, including wildlife, farmers, municipalities and others.  If water from natural flows and the system of reservoirs is not sufficient to meet these targets, the Truckee River Operating Agreement allows Lake Tahoe to be drawn down to meet needs if water levels in the lake permit this. 
 
Graph of  Discharge, cubic feet per secondNote that as of 31 March, the flow rates at the Farad gage were less than the target (500 cubic feet per second).  Remember that the target is average flow, which means that sometimes flows can exceed or be less than the target. 
 
If you have Google Earth on your computer try going to the location of the Farad gage to see where it lies in course of the Truckee River.  The latitude and longitude of the station are Latitude  39°25'41", Longitude 120°01'59".  If you zoom in enough and look carefully you can see a cable that runs from the station across the river.  The cable is for a small cart that can be used to take measurements of flow as part of regular efforts to maintain the mathematical relationship used to estimate flow rates from stage height (called the "rating curve").  Given the importance of flow estimates from this gaging station, you can imagine that the U.S. Geological Survey checks the rating curve often and makes adjustments as needed. 


.

March 1, 2014 State of Nevada Estimates Show Lack of Snow Accumulation


March 1, 2014 State of Nevada Estimates Show Lack of Snow Accumulation

Snow has accumulated since the beginning of March, 2014, but the storms have not been so significantly large that they have produced the overall amounts in the locations shown on this map.  The Sierra Crest shows accumulations of 20 to more than 90 inches on the ground at higher elevations on March 1, 2014.  As mentioned in earlier posts, this is important because snowpack serves as the sustaining source of water for the major systems originating in the Sierra Crest (including the Truckee, the Carson and the Walker Rivers). We rely on deep snowpack that does not warm and melt too quickly.  The snowpack serves almost as a reservoir without a dam. 

Looking eastward from the Sierra Crest we can see that accumulations across the state are very low, especially in the area that lies beneath the persistent area of exceptional drought shown in last week's drought report.  The April 1 water supply outlook, due out tomorrow, will have the latest information about snowpack accumulations throughout the state.  Given recent storm fronts sweeping to the east, our snowpack accumulations should improve.  However, it is important to remember that snowpack is only part of the story--the snow needs to melt slowly enough so that it is released over months to sustain flows and fill reservoirs. 

Thursday, March 27, 2014

Current status of drought conditions.

Current status of drought conditions.

The latest drought report from the National Drought Monitor shows an expansion of the formerly crescent-shaped EXCEPTIONAL drought zone in the center of the state (up 2.87% in area assumed to be affected).  This represents a revision from March 18th based on state and federal data and consultation and consensus interpretation.

It is important to remember that the maps are compiled from a wide range of observations and that the depicted drought zones do not represent completely homogeneous conditions.  However, the general message is that drought conditions in Nevada's central northwestern counties (Churchill, Lyon, Lander and now part of Humboldt) persist and the outlook has not improved over the past week. 

At the same time, the Truckee Meadows Water Authority recently issued a statement that water supplies from Lake Tahoe and the reservoir system will be sufficient to meet peak demands through the summer months (until the end of August).  This is based on the best projections from information and analyses.  As an example, the Federal Water Master for the Tahoe-Truckee system issues weekly reports that indicate the probability of specific flow rates at different points, from Tahoe to Pyramid Lake.  These represent potential wet conditions (indicated by the 30% trace on the graph below) and potential dry conditions (indicated by the 70% trace on the graph below).  This graph (projected mean monthly flow rates at the U.S. Geological Survey stream gaging site at Farad (just upstream of the Nevada/California border) estimates that with all flows combined (that means natural flows in the Truckee and releases from the upstream reservoirs) supplies may be sufficient to meet the Floriston rate (more on what that is in the next post) under the wet (30%) and medium wet (50%) scenarios.  However, if our snowpack and reservoir storages remain low and we have a dry (70%) scenario, this may lead to some difficulties meeting the Floriston rate as the summer progresses.  It is important to remember that the projections on this graph represent current observations of the snow pack and reservoir storage--winter snow accumulations may continue, which means the projections will likely change as conditions change. 


Thursday, March 13, 2014

Conditions and drought assessment remain about the same

Conditions and drought assessment remain about the same


The area designated as D4: Exceptional drought and the surrounding areas, designated as D3:  Extreme drought, despite recent storms (see below).  The 10 day weather forecast (until 3/22/14) for Truckee, CA forecasts a 40% chance of snow showers on May 20th (next Thursday), with warm and windy weather between now and then.  Currently (3/12/14) Lake Tahoe's water level is at 6224.2 ft above mean sea level (http://bit.ly/1iD2gcw).  This is between the levels observed in 2010 and 2011on this date. 


Monday, March 3, 2014

Soil Moisture Content Improving in Sierras

Soil Moisture Content Improving in Sierras


The last several storms in the Sierras have increased the moisture content of soils on the Sierra Crest.  The graph below (from the Big Meadow SNOTel site, north of the Mt. Rose Ski resort) shows soil moisture trends for the past 30 days at 2, 8 and 20 inches below the soil surface.  A storm several days before the increase in soil moisture on Feb 14th seems to have left enough snow to change soil moisture content.  This is good--remember the agricultural definition of drought?  It is related to soil moisture availability to support plant growth.  Also, the graph appears to show that moisture is sinking into the soil, changing the soil moisture availability at 20  inches below the soil surface as well as at 2 inches below the soil surface.  Note the lag between the rise on Feb 14th at 2 inches (green line) and the rise at 20 inches (red line).  It looks like it takes about a day for the effects seen at 2 inches to reach 20 inches. 


  Scan Site Plot
Scan Site Plot

Saturday, March 1, 2014

Snow water equivalent measurement

Snow water equivalent measurement:


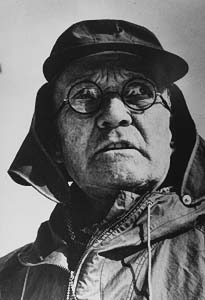
Historical photograph (circa 1907) of Dr. James E. Church - Courtesy of the Western Snow Conference
Photo of Dr. James Church--l
ikely in the vicinity of Mt. Rose


Our information about the amount of water in a snowpack comes from at least two sources--the Natural Resources Conservation Service's Snow Telemetry (SNOTel) system and snow surveys (see http://www.wcc.nrcs.usda.gov/snotel/SNOTEL_brochure.pdf).  Dr. James Church, a professor of classic languages at the University of Nevada, developed techniques for measuring the water content of snowpacks based on the mass of a core extracted using a tube.  The technique is based on the mass of a cubic centimeter of frozen water, which is slightly less than the mass of a cubic centimeter of liquid water. 
Church developed the Mt. Rose sampler--a coring tool with a scale that translates mass into inches of water.  See a photo below of Church at work (courtesy of the Natural Resources Conservation Service's Snow Measurement web site (http://www.wcc.nrcs.usda.gov/snowcourse/sc-hist.html).


The Mt. Rose sampler is in common use for estimating the water content of the snowpack in snow courses.  Snow courses consist of many cores taken in a line for some distance.  Nevada's Mt. Rose Ski Resort has one of the original snow courses from early surveying work and a SNOTel site.  For recent data from the Mt. Rose Ski Resort snow course see http://1.usa.gov/1gJ0RM4.